How to Monitor WordPress Health

Senior WebCoder
You launch your site, and it runs great. Two weeks later, a client calls: "The site is down." You check, and realize it's been down for 8 hours.
This is the nightmare of every developer.
WordPress is reliable, but servers fail, plugins conflict, and hackers attack. You need eyes on your site 24/7. Here is how to build a robust monitoring stack.
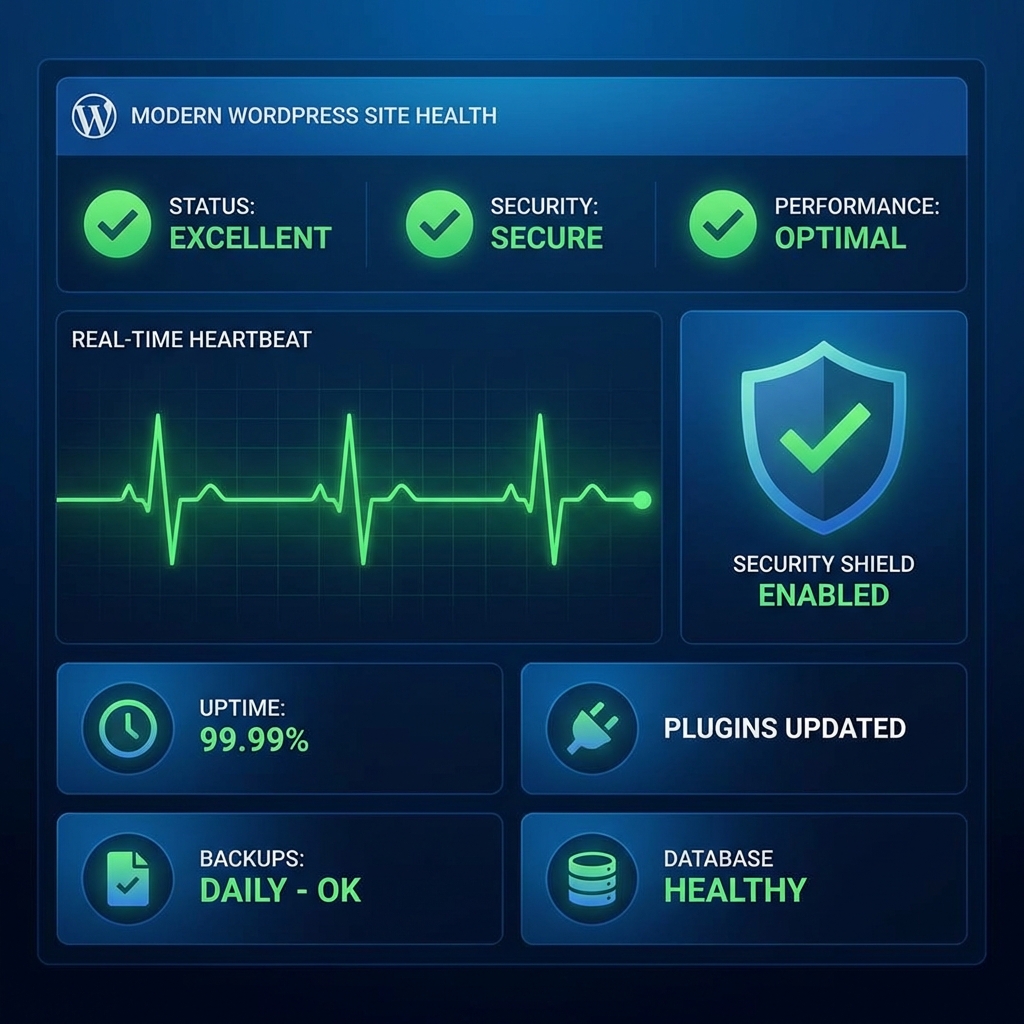
1. The Built-In "Site Health" Tool
Before installing anything, check what WordPress already knows.
Go to Tools > Site Health.
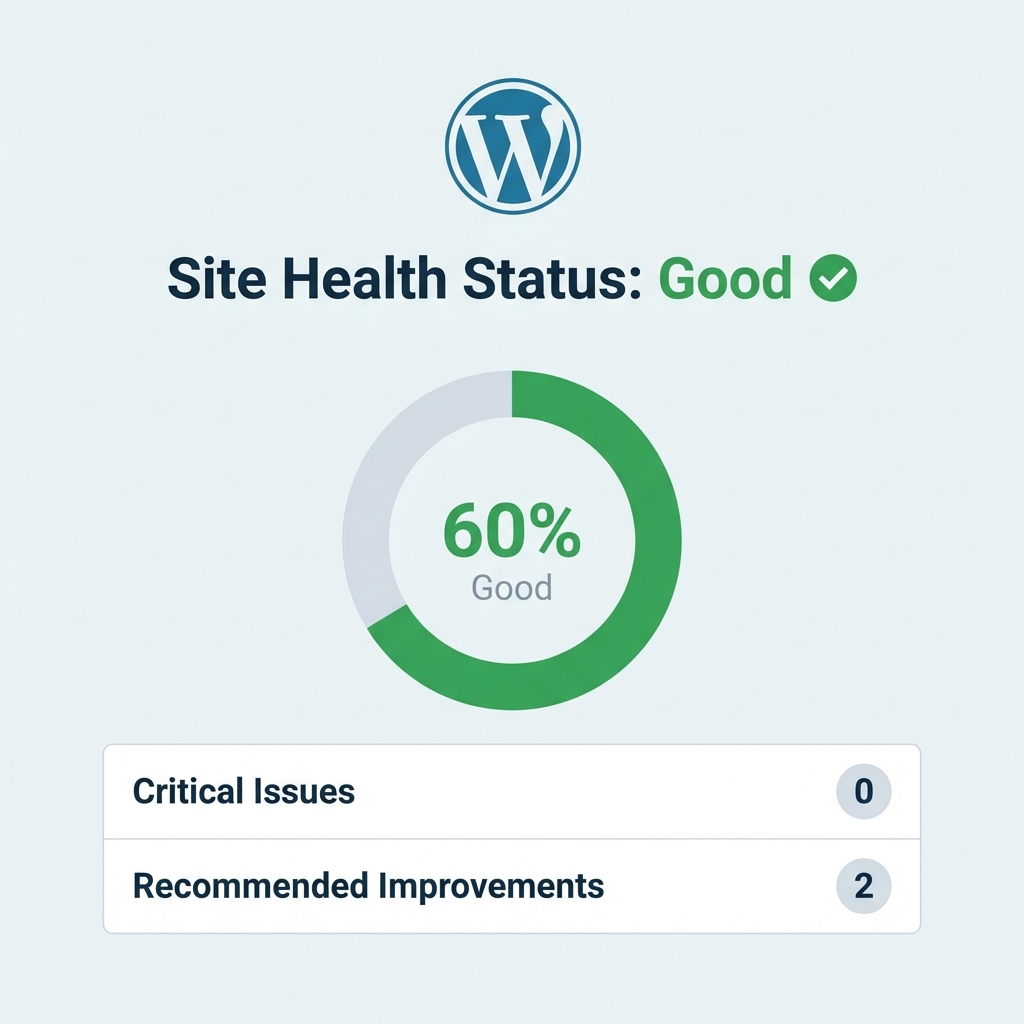
This hidden gem monitors:
- PHP Version: Is it outdated?
- SSL: Is HTTPS working?
- Database: Is the SQL server responding correctly?
- Plugin Conflicts: Are there known inactive plugins posing a risk?
Action: Check this screen once a month during your maintenance cycle.
2. Uptime Monitoring (The "Is It Down?" Check)
If your server crashes, WordPress can't email you (because the server is down!). You need an external monitor.
Top Tools:
- UptimeRobot (Free): Checks your site every 5 minutes. Sends an email/SMS if it returns a 500 error or timeout.
- Better Uptime: More advanced, with incident management pages.
Pro Tip: Don't just monitor the homepage. Monitor a critical functionality page (like /checkout or /contact) to ensure the application is working, not just the static HTML cache.
3. Error Logging (The "What Broke?" Check)
White Screen of Death (WSOD)? 500 Server Error? The answers are in the logs.
Enable Debugging correctly
Don't display errors to the public (that's a security risk). Log them to a file.
Add this to wp-config.php:
define( 'WP_DEBUG', true );
define( 'WP_DEBUG_LOG', true );
define( 'WP_DEBUG_DISPLAY', false );
Now, all PHP warnings and fatal errors are written to /wp-content/debug.log. Monitor this file. If it starts growing rapidly (e.g., 50MB), you have a problem.
4. Security Monitoring
You need to know if files have been modified.
Wordfence or iThemes Security monitors:
- File Changes: Did
header.phpchange recently? (If you didn't do it, a hacker did). - Login Attempts: Is
adminseeing 500 failed login attempts from Russia? - Malware Scans: Automated daily checks against known vulnerability databases.
5. Performance Monitoring (Core Web Vitals)
A site that loads in 10 seconds is effectively "down" for mobile users.
Tools:
- Google Search Console: Check the "Core Web Vitals" report. It tracks real user experience (CrUX data).
- GTmetrix / PageSpeed Insights: Run weekly automated tests to catch regressions (e.g., someone uploaded a 5MB image).
6. Database Health (The Silent Killer)
Your database grows every day. Revisions, spam comments, and expired transients clog the arteries of your site.
Monitor:
- Table Size: Is
wp_optionslarger than 10MB? If so, you have an autoload issue. - Overhead: Use a plugin like WP-Optimize to check for "overhead" (wasted space) and clear it weekly.
7. The "Off-Site" Backup Check
Most hosts provide backups. Do not trust them. If your server has a catastrophic failure, your "host backup" might vanish with it.
The Rule: Always store one backup on a completely different cloud provider (e.g., AWS S3, Google Drive, or Dropbox) using a tool like UpdraftPlus.
8. REST API Status
Modern WordPress relies heavily on the REST API (especially the Block Editor). If it's blocked, your site works for visitors but breaks for admins.
Check your Site Health status for: "The REST API encountered an error." Common culprits: Security plugins (Wordfence) blocking the loopback request.
Summary
A healthy WordPress site requires a 3-layer monitoring strategy:
- Uptime: External pings (UptimeRobot).
- Internal: Error logs (
debug.log) and Site Health. - Security: File change detection (Wordfence).
Don't wait for your client to tell you the site is broken. Know it first.
Gokila Manickam
Senior WebCoder
Gokila Manickam is a Senior WebCoder at FUEiNT, contributing expert insights on technology, development, and digital strategy.